
AI brand visibility: lessons from 720 answers
18 September 2026 · By Henry Huysamen · AI-assisted review; no independent human validation
We tested three OpenAI models with and without web search across 720 answers. In the direct-API tests, search-enabled answers named fewer of the brands we tracked. But none of our five planned comparisons met the statistical significance threshold after allowing for multiple tests. The pattern is worth investigating; it does not establish a general model ranking.
For a business tracking its visibility in AI answers, one result is a limited snapshot. Repeating the same question on another date often changed which tracked brands appeared. A useful report needs to show how answers were collected, how often the test was repeated and how much uncertainty remains.
These are API results, collected on 13–14 September 2026 UTC. We tested models through software interfaces, including a smaller comparison through OpenRouter. We did not test the ChatGPT or Codex apps.
What we tested
Before collecting answers, we chose 48 software-buying questions across 12 categories, with three relevant brands to track in each category. That gave us a fixed set of 36 brands. None of the questions named a supplier, and we did not choose brands after seeing the answers.
For example, one question asked: “What website analytics software suits a two-person business with fewer than 50000 monthly page views and no dedicated analyst?” It describes a buyer's situation without steering the answer toward a particular product.
Every question went to GPT-5.6 Luna, GPT-5.6 Sol and GPT-6 Astra through OpenAI's API. We tested each model with web access disabled and with web search required, once on each of two dates. This produced 576 direct-API answers. One question per category, selected in advance, also went through OpenRouter under all six model/search combinations on both dates, adding 144 answers.
We measured whether each answer named each of the three tracked brands for its category. An appearance rate of 70% means that 70% of those possible brand mentions were present, averaged across the answers. It is not a measure of market share or the likelihood that a customer will buy.
A mention is not necessarily an endorsement, either. An answer could name a brand to advise against it, and we would still count that appearance. A shorter answer might recommend other suitable products. We did not score recommendation quality, factual accuracy or sales outcomes.
What the results show
In all three direct-API models, answers generated with required web search named fewer of the tracked brands:
Scroll the table sideways to see every column →
| Model | Web access disabled | Required web search | Difference |
|---|---|---|---|
| Luna | 76.74% | 69.79% | −6.94 percentage points |
| Sol | 76.04% | 68.06% | −7.99 percentage points |
| Astra | 68.06% | 60.76% | −7.29 percentage points |
Each rate comes from 96 answers, with three brand checks per answer: 288 checks in total. The scores are automated, with the limited AI-assisted review described below.
Answers about the same category are related, as are repeated questions and brands within an answer. We therefore calculated uncertainty from 12 paired category comparisons, giving each category equal weight. Counting all 720 answers as independent evidence would overstate certainty. The categories were also chosen deliberately, not randomly sampled from the whole software market.
We planned five comparisons before collecting answers. Two compare models, averaging across the web and no-web settings. Three compare search with no web access within each model.
Scroll the table sideways to see every column →
| Comparison | Difference, percentage points | Nominal 95% interval | Adjusted p value |
|---|---|---|---|
| Sol − Luna | −1.22 | −4.51 to +2.26 | .506 |
| Astra − Sol | −7.64 | −12.67 to −2.60 | .068 |
| Search − none: Luna | −6.94 | −13.19 to 0.00 | .232 |
| Search − none: Sol | −7.99 | −15.28 to +0.35 | .232 |
| Search − none: Astra | −7.29 | −11.81 to −2.78 | .058 |
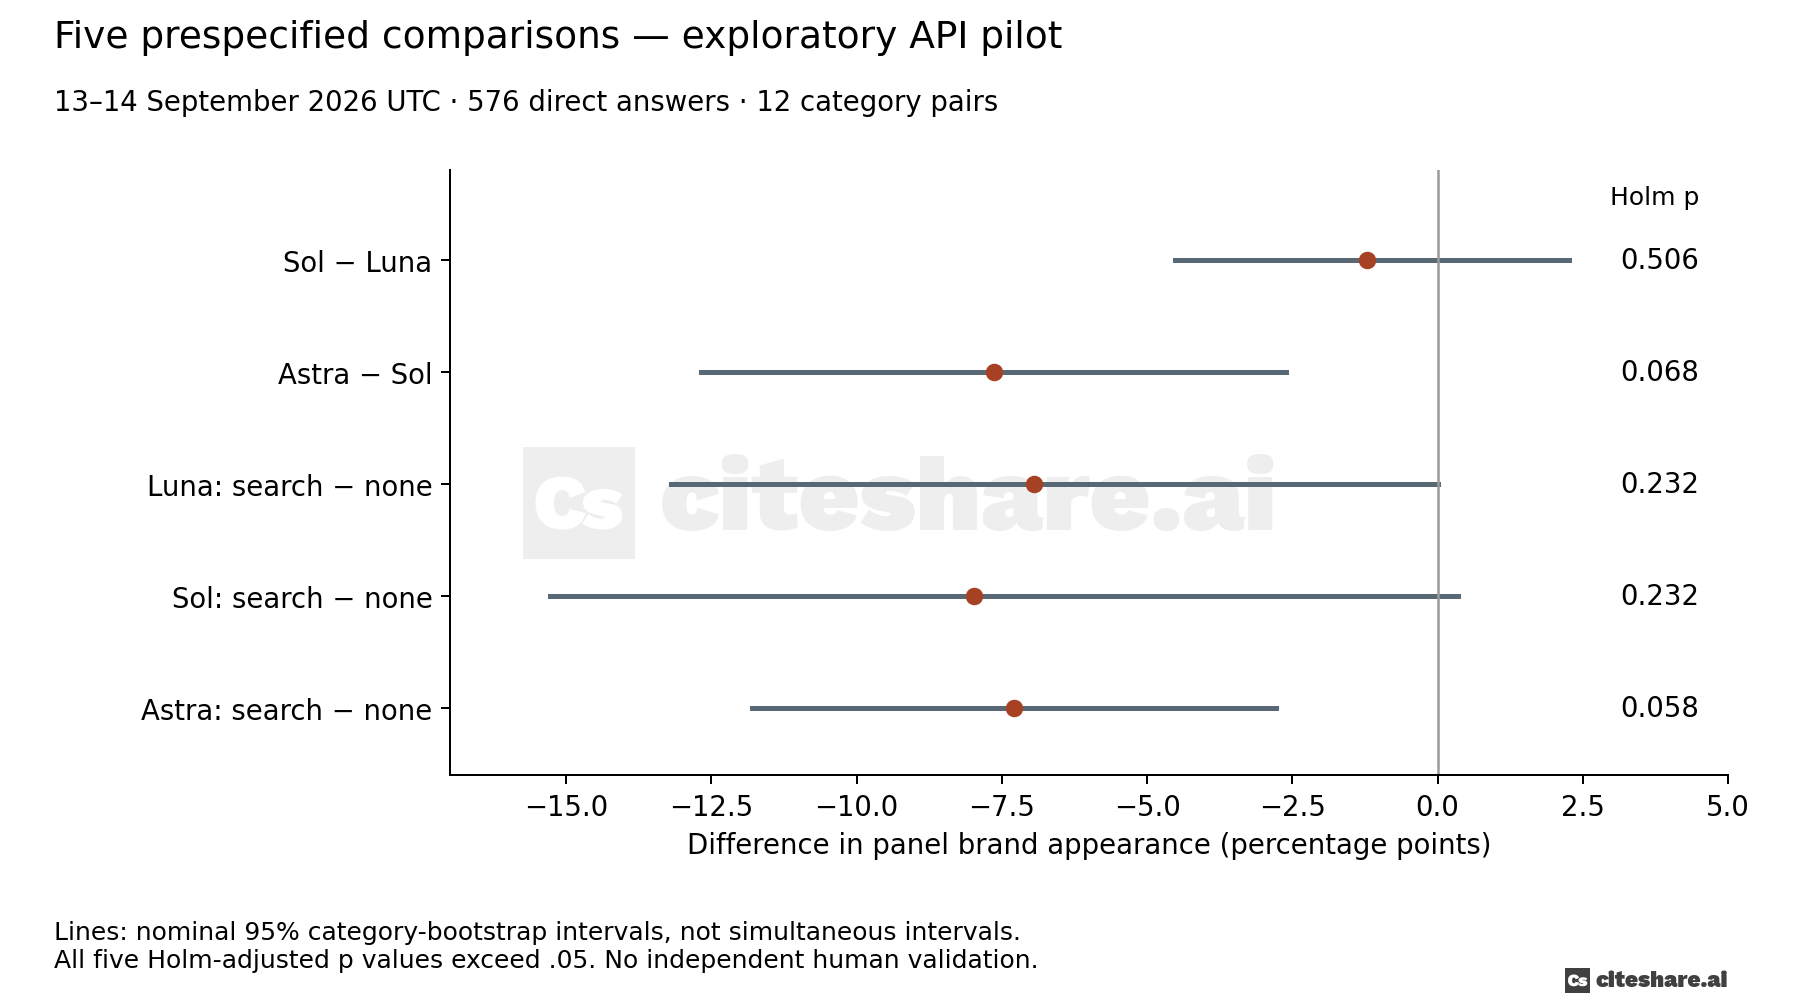
Testing several comparisons creates more opportunities to mistake chance variation for a finding. We used the Holm adjustment to account for that. All five adjusted p values are above our .05 threshold, so none qualifies as statistically significant under the planned tests. This also does not prove that the configurations are equivalent.
The 95% intervals describe uncertainty for each comparison, calculated by resampling categories. They are not adjusted for multiple tests, so an interval can exclude zero while the adjusted test still falls short. The methods and results explains the calculations.
For someone reading a brand-visibility dashboard, the distinction matters: an observed difference is a reason to investigate, not by itself proof that one setup consistently gives a brand more exposure.
Search settings are part of the measurement
Each searched answer was allowed at most two hosted tool calls, limiting how much searching the model could do. Reasoning and output limits were also fixed; the full settings are in the protocol.
In 197 of 288 direct-API search answers (68.4%), the activity record showed another pending attempt after two completed calls. Those further attempts were limited by the configuration. The answers completed, but they were produced within a restricted search budget.
These findings describe that particular setup. They cannot tell us what a larger search budget or unrestricted research would produce. For a client comparing visibility reports, “web search enabled” is therefore only part of the specification; the allowed search activity matters too.
Does the provider route matter?
OpenRouter provides another route to the models. On the matched questions, its average appearance rate was 0.93 percentage points below the direct API. We treated this as a descriptive comparison and did not run a confirmatory significance test. We restricted OpenRouter to OpenAI as the upstream provider and disabled fallback providers.
Even then, the search records did not line up neatly. In 52 of 72 OpenRouter search answers, three tool entries appeared while usage counters reported no more than two searches. Some extra entries were marked completed. We could not establish whether those entries represented additional activity or differences in how the services recorded it.
The small observed gap does not establish that the routes are interchangeable, and we cannot attribute it solely to OpenRouter. If a visibility report changes provider route, that change should be visible in the reporting history. A matching prompt and model name do not, on their own, establish an identical test.
Why repeat the same question?
For each direct-API setup, we compared the same 48 questions across the two dates. The set of tracked brands changed in 10 to 19 question pairs, depending on the setup: 20.8% to 39.6%. Even when the same brands appeared, the wording, order or recommendation could still differ.
Two dates cannot tell us how much of this variation came from randomness, retrieved information or changes in the underlying service. They do show why a single answer is an incomplete picture of visibility in this sample.
For example, seeing your brand disappear from one repeated answer would not, by itself, establish a sustained decline. Nor would one new mention establish that a recent website update had worked. This experiment did not test website changes, so it cannot identify a tactic that causes more mentions.
What this means for your visibility reporting
The practical implications concern how to measure visibility. They are not evidence that a particular optimization will improve it.
Start with a defined buyer situation. Record the questions, the audience they describe and the brands being tracked. Our fixed set made comparisons possible, but it also set the limits of the result: fewer mentions of those brands does not mean fewer useful recommendations overall.
Keep the test conditions visible. Preserve the question wording, model, provider route, web-search settings and date. Repeat the questions under documented conditions before interpreting a change. If the setup changes, make that clear rather than presenting the two measurements as directly comparable.
Read beyond the appearance rate. Check whether the brand is recommended, compared or discouraged, and whether links support the claims made. Those require separate assessments; our appearance scores do not answer them. A mention count is one part of a visibility report, not a substitute for reading what the buyer would see.
Cost, review and the next study
The pilot and preliminary capability checks account for $65.22 against a $100 ceiling. The capability checks were excluded from the findings. Direct-API costs are conservative usage estimates; OpenRouter costs are provider-reported. The total has not been reconciled against external invoices and excludes existing subscriptions and human review time.
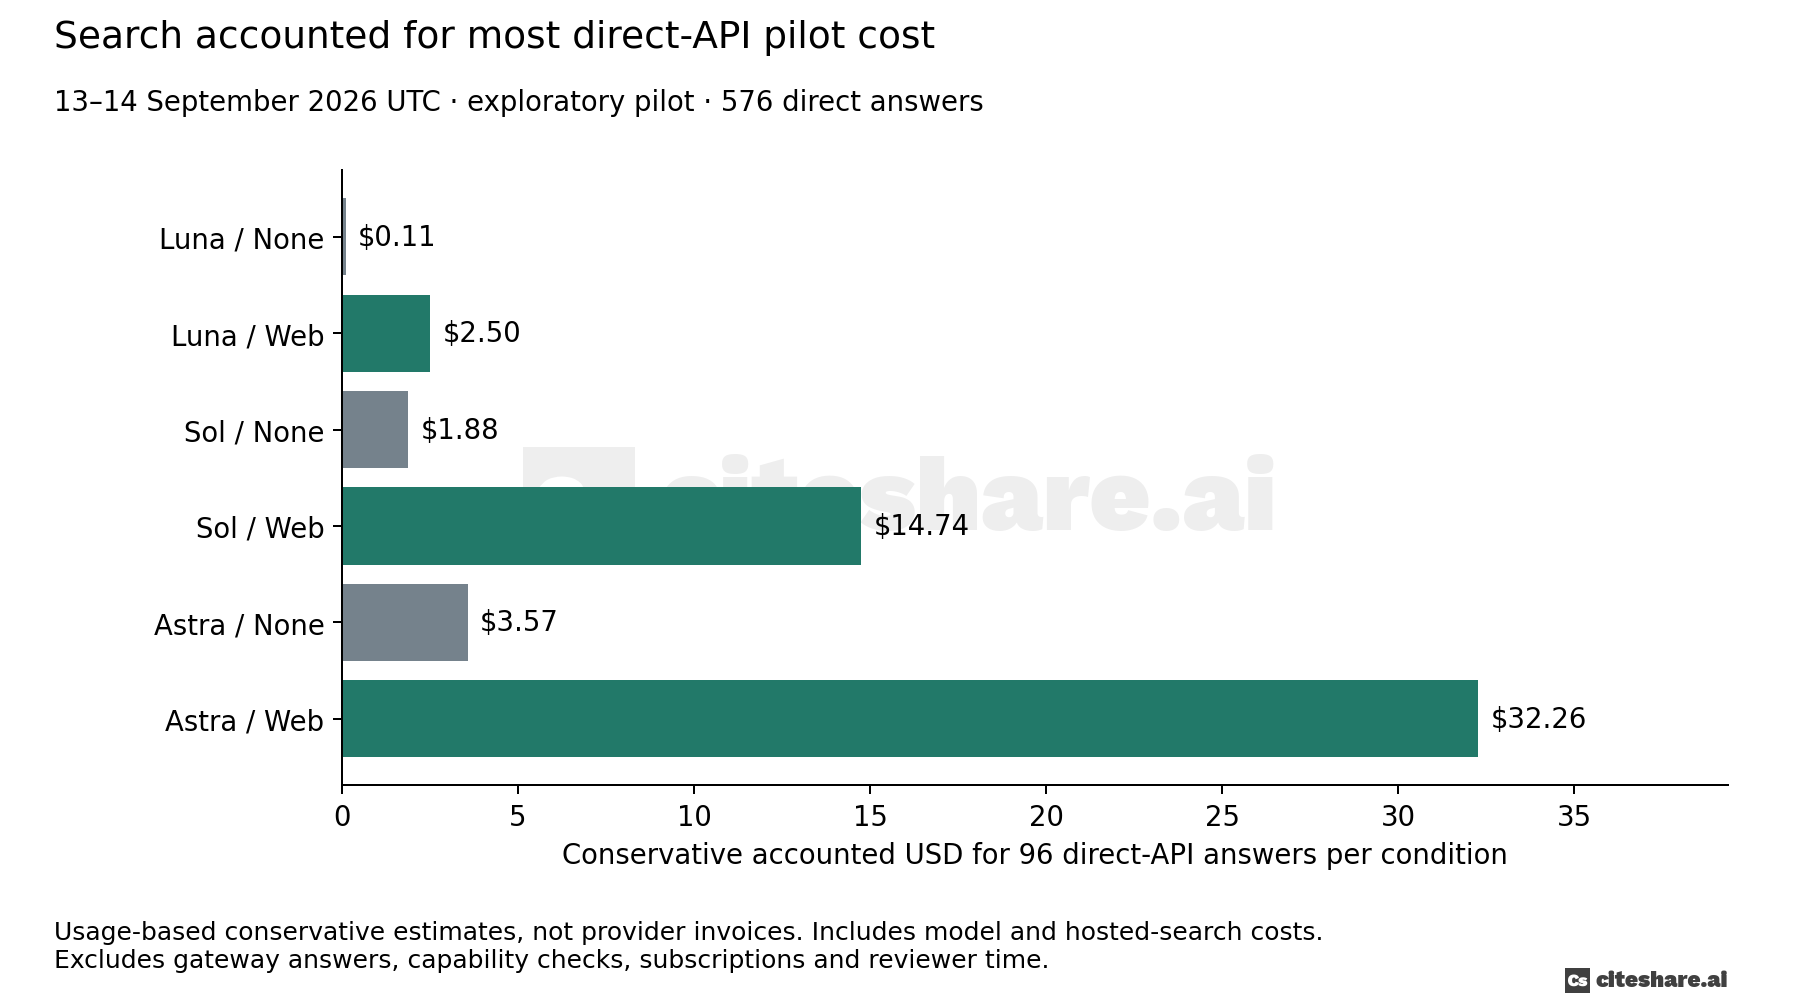
The budget supported a pilot, not the broader study suggested by our preliminary sample-size simulation. Under our planning rule, the first qualifying scenario needed 60 independent categories and 2,880 direct answers: roughly $275 at the observed cost mix. That estimate is uncertain, and we have not established a suitable set of 60 independent categories. More similar questions would not automatically supply more independent evidence.
Review is AI-assisted only, at the study owner's direction. The 150-answer sample received product-context checks for positive labels and automated name-matching checks for negatives. A separate, overlapping review covered all ambiguous-name positives. Neither review changed the appearance scores.
The review did find missed product links: a correction added 28 official-domain link labels in 13 answers, preserving the original scores separately. The appearance results stayed the same. All affected answers had web access disabled; a link alone is not evidence that a model browsed.
The assistant had already seen the findings, so this was neither blinded nor independent human validation. Citation support, URL accessibility and answer accuracy were not checked. Human review is deferred; the review record documents the details.
Actual ChatGPT versus Codex is a separate follow-up, requiring new dates and verified product settings. Those apps may have different instructions and tools from the API setups tested here, so no app results are implied by this pilot.
Methods, evidence and disclosure
This English-language study was framed around US buyers and does not represent all buyers or software markets. Brand prominence was not independently classified, and model aliases may change over time. We froze the design locally before collection, without external preregistration. A confirmatory study would need new questions kept out of this pilot.
The methods and results records the tests, uncertainty, planning assumptions and deviations. The protocol, question bank, brand panel and aggregate results accompany this article. Raw responses remain private pending a separate data-release review.
The design draws on task-specific evaluation and human calibration in OpenAI's evaluation guidance, explicit scenarios and multiple metrics in HELM, and design-appropriate paired testing discussed by Dror and colleagues. The sample, five-comparison plan and spending limit are our study choices, not requirements imposed by those sources.
Citeshare has a commercial interest in AI brand-visibility measurement. Henry Huysamen authorized the research budget; the workflow, analysis and article were prepared with Codex assistance. Human scoring is deferred, and final cost reconciliation remains pending. No provider reviewed this article in this workflow.